I've been data mining ~10 years of projects from sourceforge for awhile now to try to understand how languages spread and factors in people adopting them... It's been tricky, but I found the following charts pretty interesting:

(probability of the category for a project given the language)
(1: given a project with N developers, likelihood of being in a particular language, 2: likelihood of a project having N developers in language L)

(log number of developers with N projects)

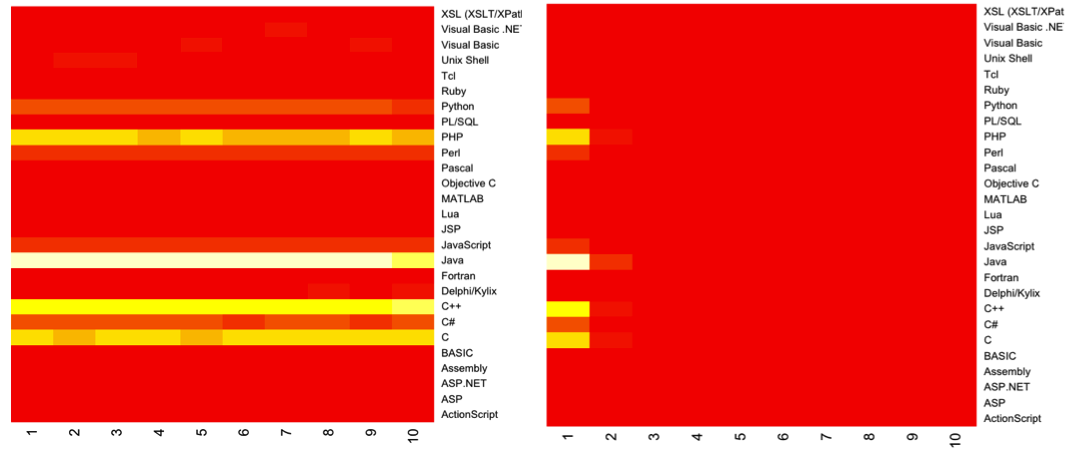
(increasing use of a language for different tasks over 10 years -- 1: Java, 2: Python)

(increasing use of a language for different tasks over 10 years -- 1: Java, 2: Python)
Next step: correlating factors to explain this stuff.
4 comments:
First image has the bottom text cut off. It is probably the most interesting.
Image 2a) doesn't seem to be more informative than "popular languages are more popular". 2b) suggests that some languages attract loners ;-). It might also be the case that these communities have other sites for open source developers (e.g. Apache for Java) that attract the well connected developers.
I'm not sure what image 4 says. Java peaked in popularity a while ago, and now Python is peaking? There doesn't seem to any consistent trend for any particular category over time, but rather an increase across the board for both languages. Perhaps you forgot to normalise this data? Naturally there will be more projects on SF now than 10 years ago so if you haven't normalised by the total number of projects in each year I'd expect to see this effect.
In the first chart, the lower text labels are cropped :)
Yeah those were just first glances. I might post bigger ones later (I drop a lot of the low frequency categories that people might be interested).
Right now, I'm focusing on predicting which language is used for which project (e.g., a simple but brutally effective gauge is the language you used previously). Haven't done any machine learning nor statistics for a year so it's been rough slogging :)
4 is tricky. I want to show language growth, but normalizing by # of projects in that year will show popularity relative to other languages: even if a language grows, doing normalizing this way could show a decrease in popularity. Not sure how to decouple increasing popularity of open source, sourceforge, and programming from language popularity -- there are already oddities surfacing like the spike in 2007 and the fade out in 2009 (that weird band on the right), which might be due to changes in SF settings or the rise of sites like google code.
While these are interesting at a surface level, I want to start trying to answer questions with the data. Going to try to crank out an interesting predictor this weekend for which language gets picked for a project using some funny tensor factorization etc. algorithms that I don't yet understand. Any thoughts would be welcome -- I'm thinking of also trying to do a user survey of perceived important factors in picking a language to compare against (sort of like the righttoolforthejob survey but a little more planned for getting at particular data).
Post a Comment